Case Study #2: From 14 Hours to 6 — Diagnosing a PySpark Performance Problem
Today I want to share a case study of one of those problems that looks scary on paper but turns out to have a surprisingly clean solution once you know where to look. It was one of those experiences that really reinforced for me how important it is to understand what is actually happening before writing a single line of code.
We were ingesting weekly market research data — around 50 GB per delivery, containing sales volume and value broken down by region and product. The file arrived once a week. Business teams needed it processed and available by early morning to support their daily analyses.
The pipeline was starting at 9 PM and finishing around 11 AM the next day. Fourteen hours. The business needed the data by 6 or 7 AM. We were already four hours late.
Starting with the Spark UI
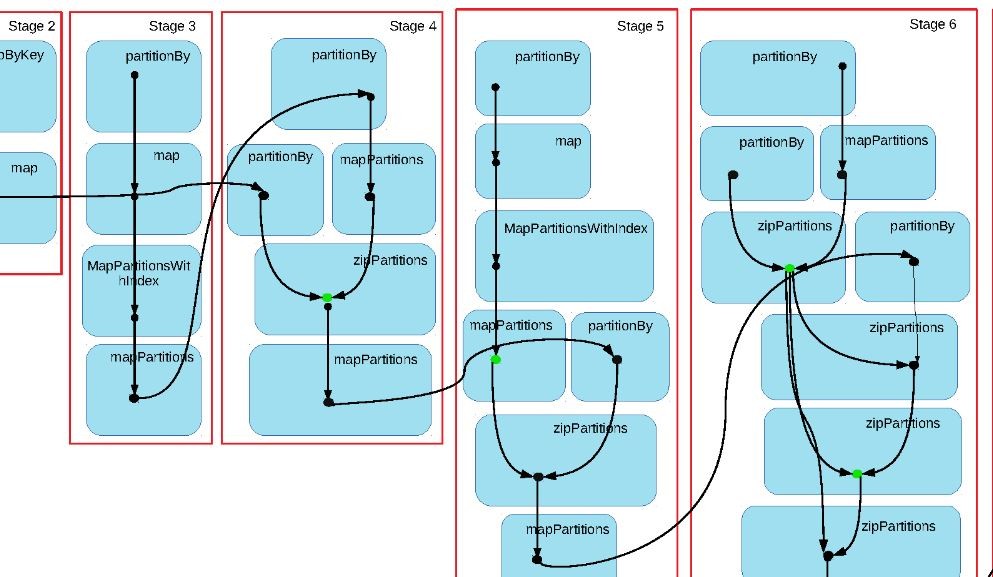
Before touching a single line of code, I opened the Spark UI and looked at the execution plan.
What I found was clear: 12 parallel stages, each a groupBy operation, all reading from the same base table. Each KPI had its own aggregation. That meant the same 50 GB dataset was being read 12 times — once per metric. Twelve separate actions on the same data.
That alone explained most of the runtime.
Two changes
1. Full overwrite → delta load
The source file came with a full 1-year history. Every week, it included the previous 52 weeks plus the new one. The critical part of ingestion was always the new week — that was what business needed for their morning reports. Historical corrections existed, but they were small.
So we changed the strategy: during the weekly run, we only processed and appended the new week’s data. On weekends, we ran a full reload of the 1-year window to capture any historical adjustments. This eliminated the full-scan processing on the run that actually mattered.
2. Consolidate groupBys, replace with window functions
Instead of 12 separate aggregations on the same base table, I reorganized the pipeline. KPIs that shared the same granularity and dimensions were grouped into single aggregation steps. For cases where the calculation allowed it, I replaced groupBy with window functions (partitionBy) — which process data in a single pass instead of triggering a full shuffle per metric.
Before the refactor: the same base table was read approximately 12 times.
After: approximately 3 reads.
Results
- Pipeline runtime: 14 hours → 6 hours
- Data available: ~4 AM instead of 11 AM
- The earlier delivery created a buffer to run data quality checks before business teams started their day
What this taught me
Performance problems in PySpark are often structural, not infrastructure. Before adjusting cluster configurations or scaling up resources, the Spark UI will usually tell you where the actual problem is.
In this case, it was a design pattern — one aggregation per KPI — that was responsible for most of the runtime. The fix was not adding more compute. It was reading the execution plan first.